Marketing Analytics & Cross-Channel Attribution
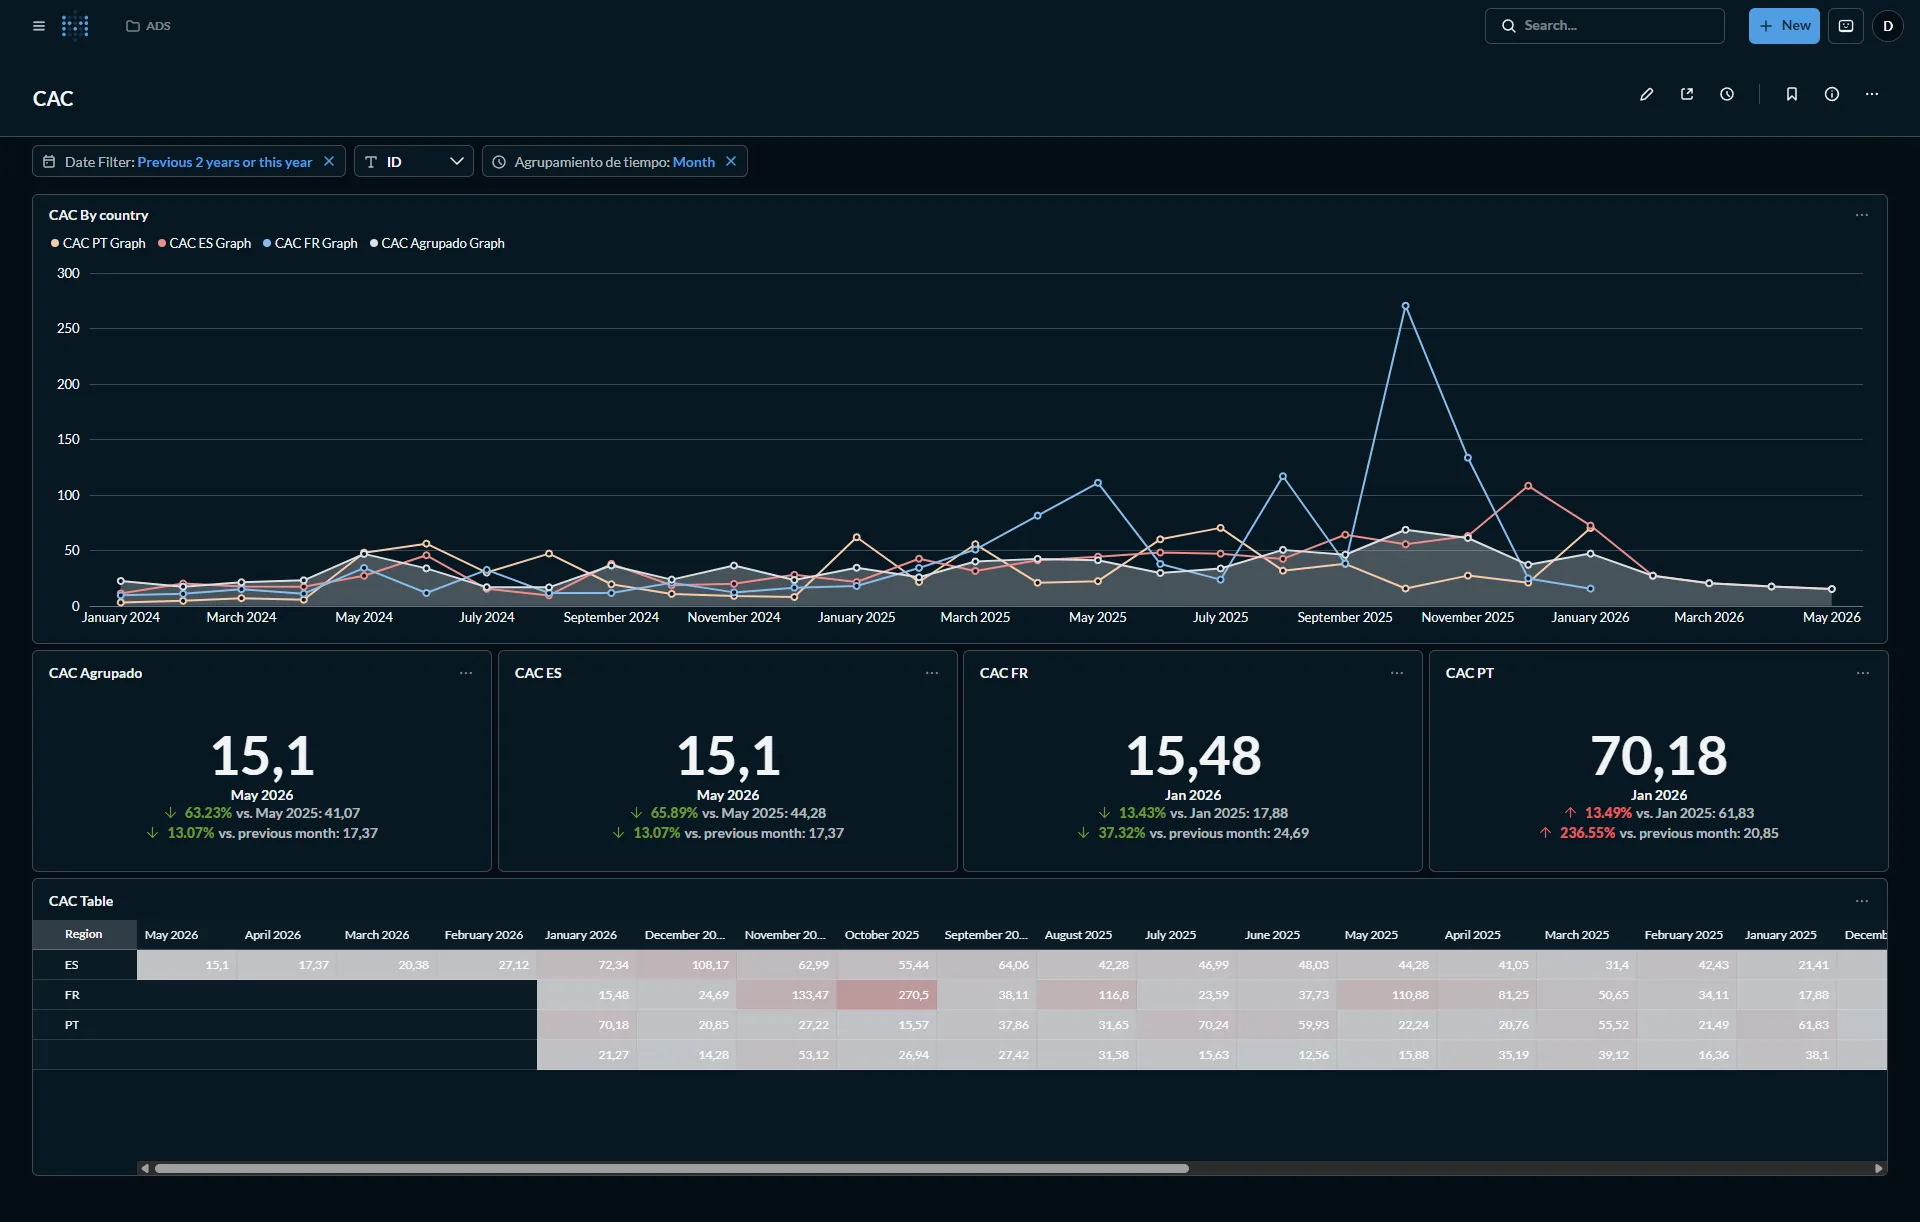
Cutting CAC 63% by unifying Google, Meta, and Amazon Ads into one blended view
A European DTC e-commerce brand selling across Spain, France, and Portugal was running Google Ads, Meta Ads, and Amazon Ads with no shared source of truth, each channel reported its own numbers, in its own currency of "success," with no way to see blended CAC or ROAS across the whole business.
- Industry
- DTC E-commerce (EU)
- Markets
- ES · FR · PT
- Channels
- Google · Meta · Amazon
- Outcome
- −63% CAC YoY
The Challenge
- Three ad platforms, three country markets, zero unified reporting layer.
- Spend and conversion data lived in separate dashboards with different attribution windows, making it impossible to compare channel efficiency apples-to-apples.
- Leadership couldn't answer a basic question: "what's our blended customer acquisition cost this month, and is it going up or down?" without manually stitching together exports.
What We Built
- A unified analytics layer pulling Google Ads, Meta/Facebook Ads, and Amazon Ads spend and conversion data into one model.
- Blended and per-channel ROAS, ROI, CPC, and CPM tracking, broken out by country (ES/FR/PT) and by campaign.
- A standardized CAC calculation applied consistently across all three channels and markets, so "customer acquisition cost" finally meant the same thing everywhere.
- Month-over-month and year-over-year trend views for direction, not just snapshots.
The Results
−63%
Blended CAC, year-over-year
+108%
Google Ads ROAS growth, YoY
3 → 1
Channels unified into one view
"We finally know what's actually working, by channel, by country, by month. That visibility changed how we allocate budget."
Free audit
Want this kind of visibility into your own ad spend?
Book a free 30-minute audit call. We'll show you exactly where your blended CAC is leaking.